
Candle Builder
One candle in a candlestick chart has a lot to say about price movement over time. Master the art of quickly assessing candles in these practice activities.

Convert Price to a Candle
Using a weekly price chart, construct 5 candles that represent price movement for each day. Then fill in the values in the chart to complete all of its components.
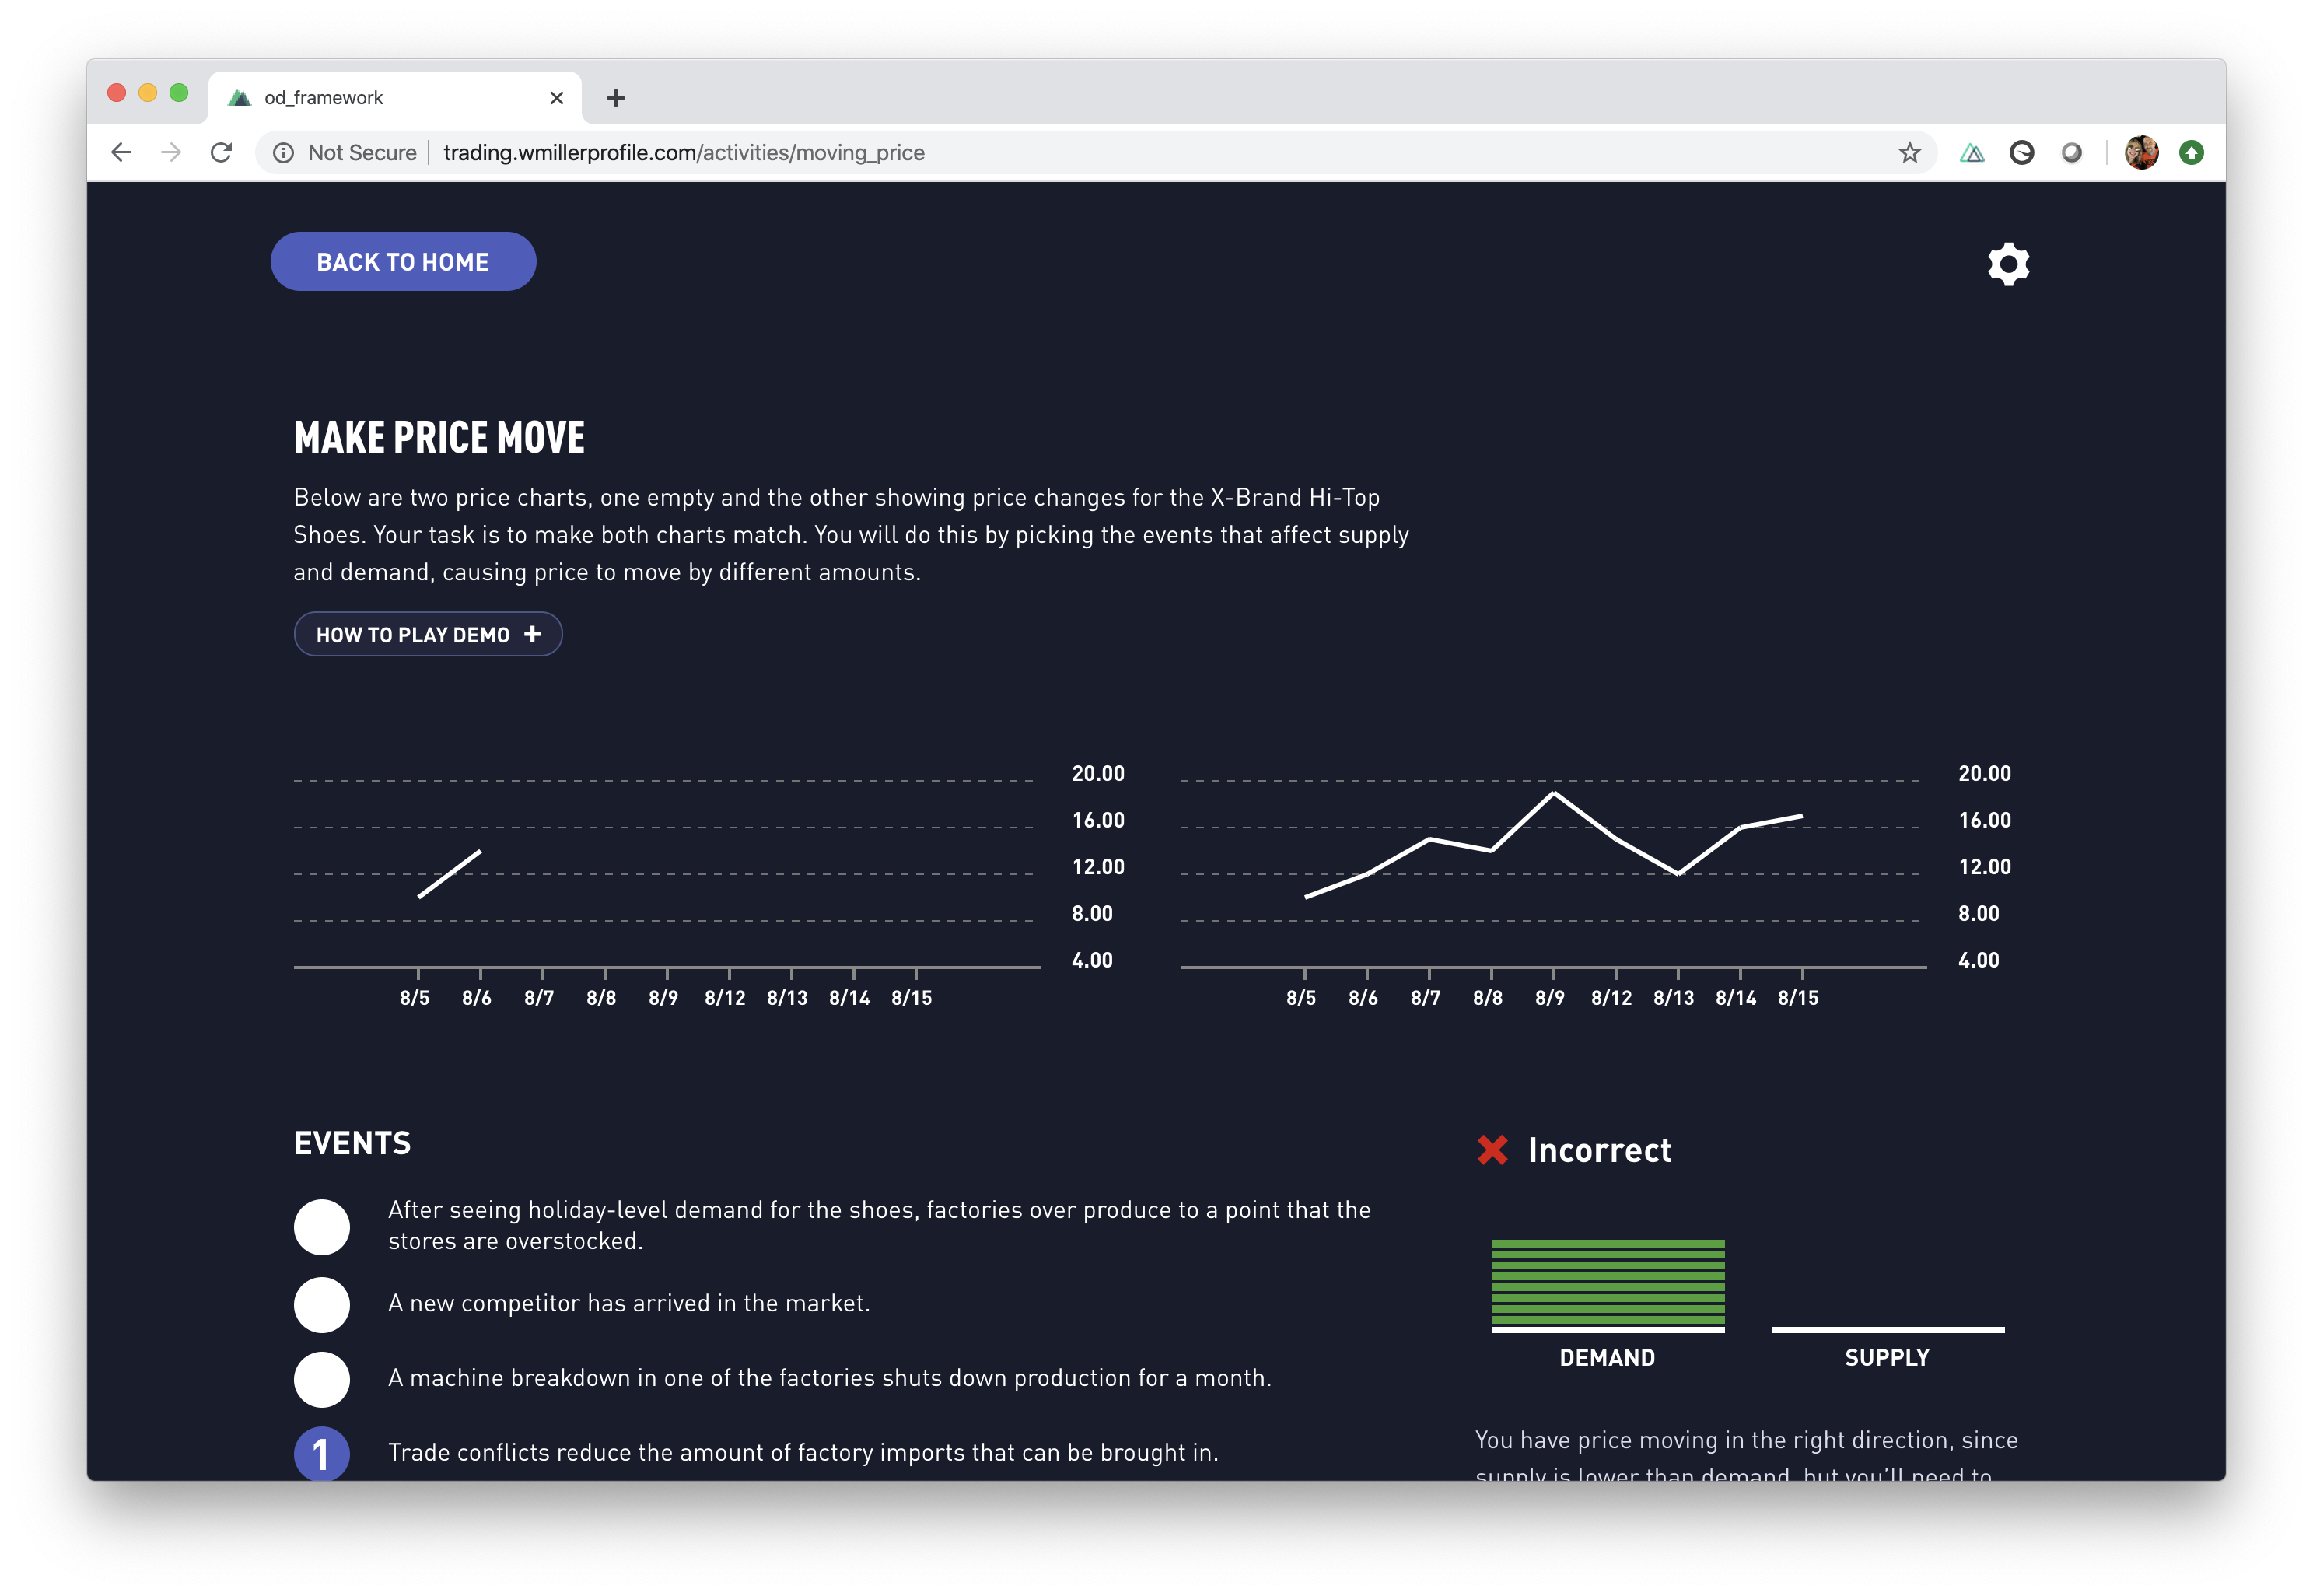
How Price Moves
Make two charts match by picking the events that affect supply and demand, causing price to move by different amounts.
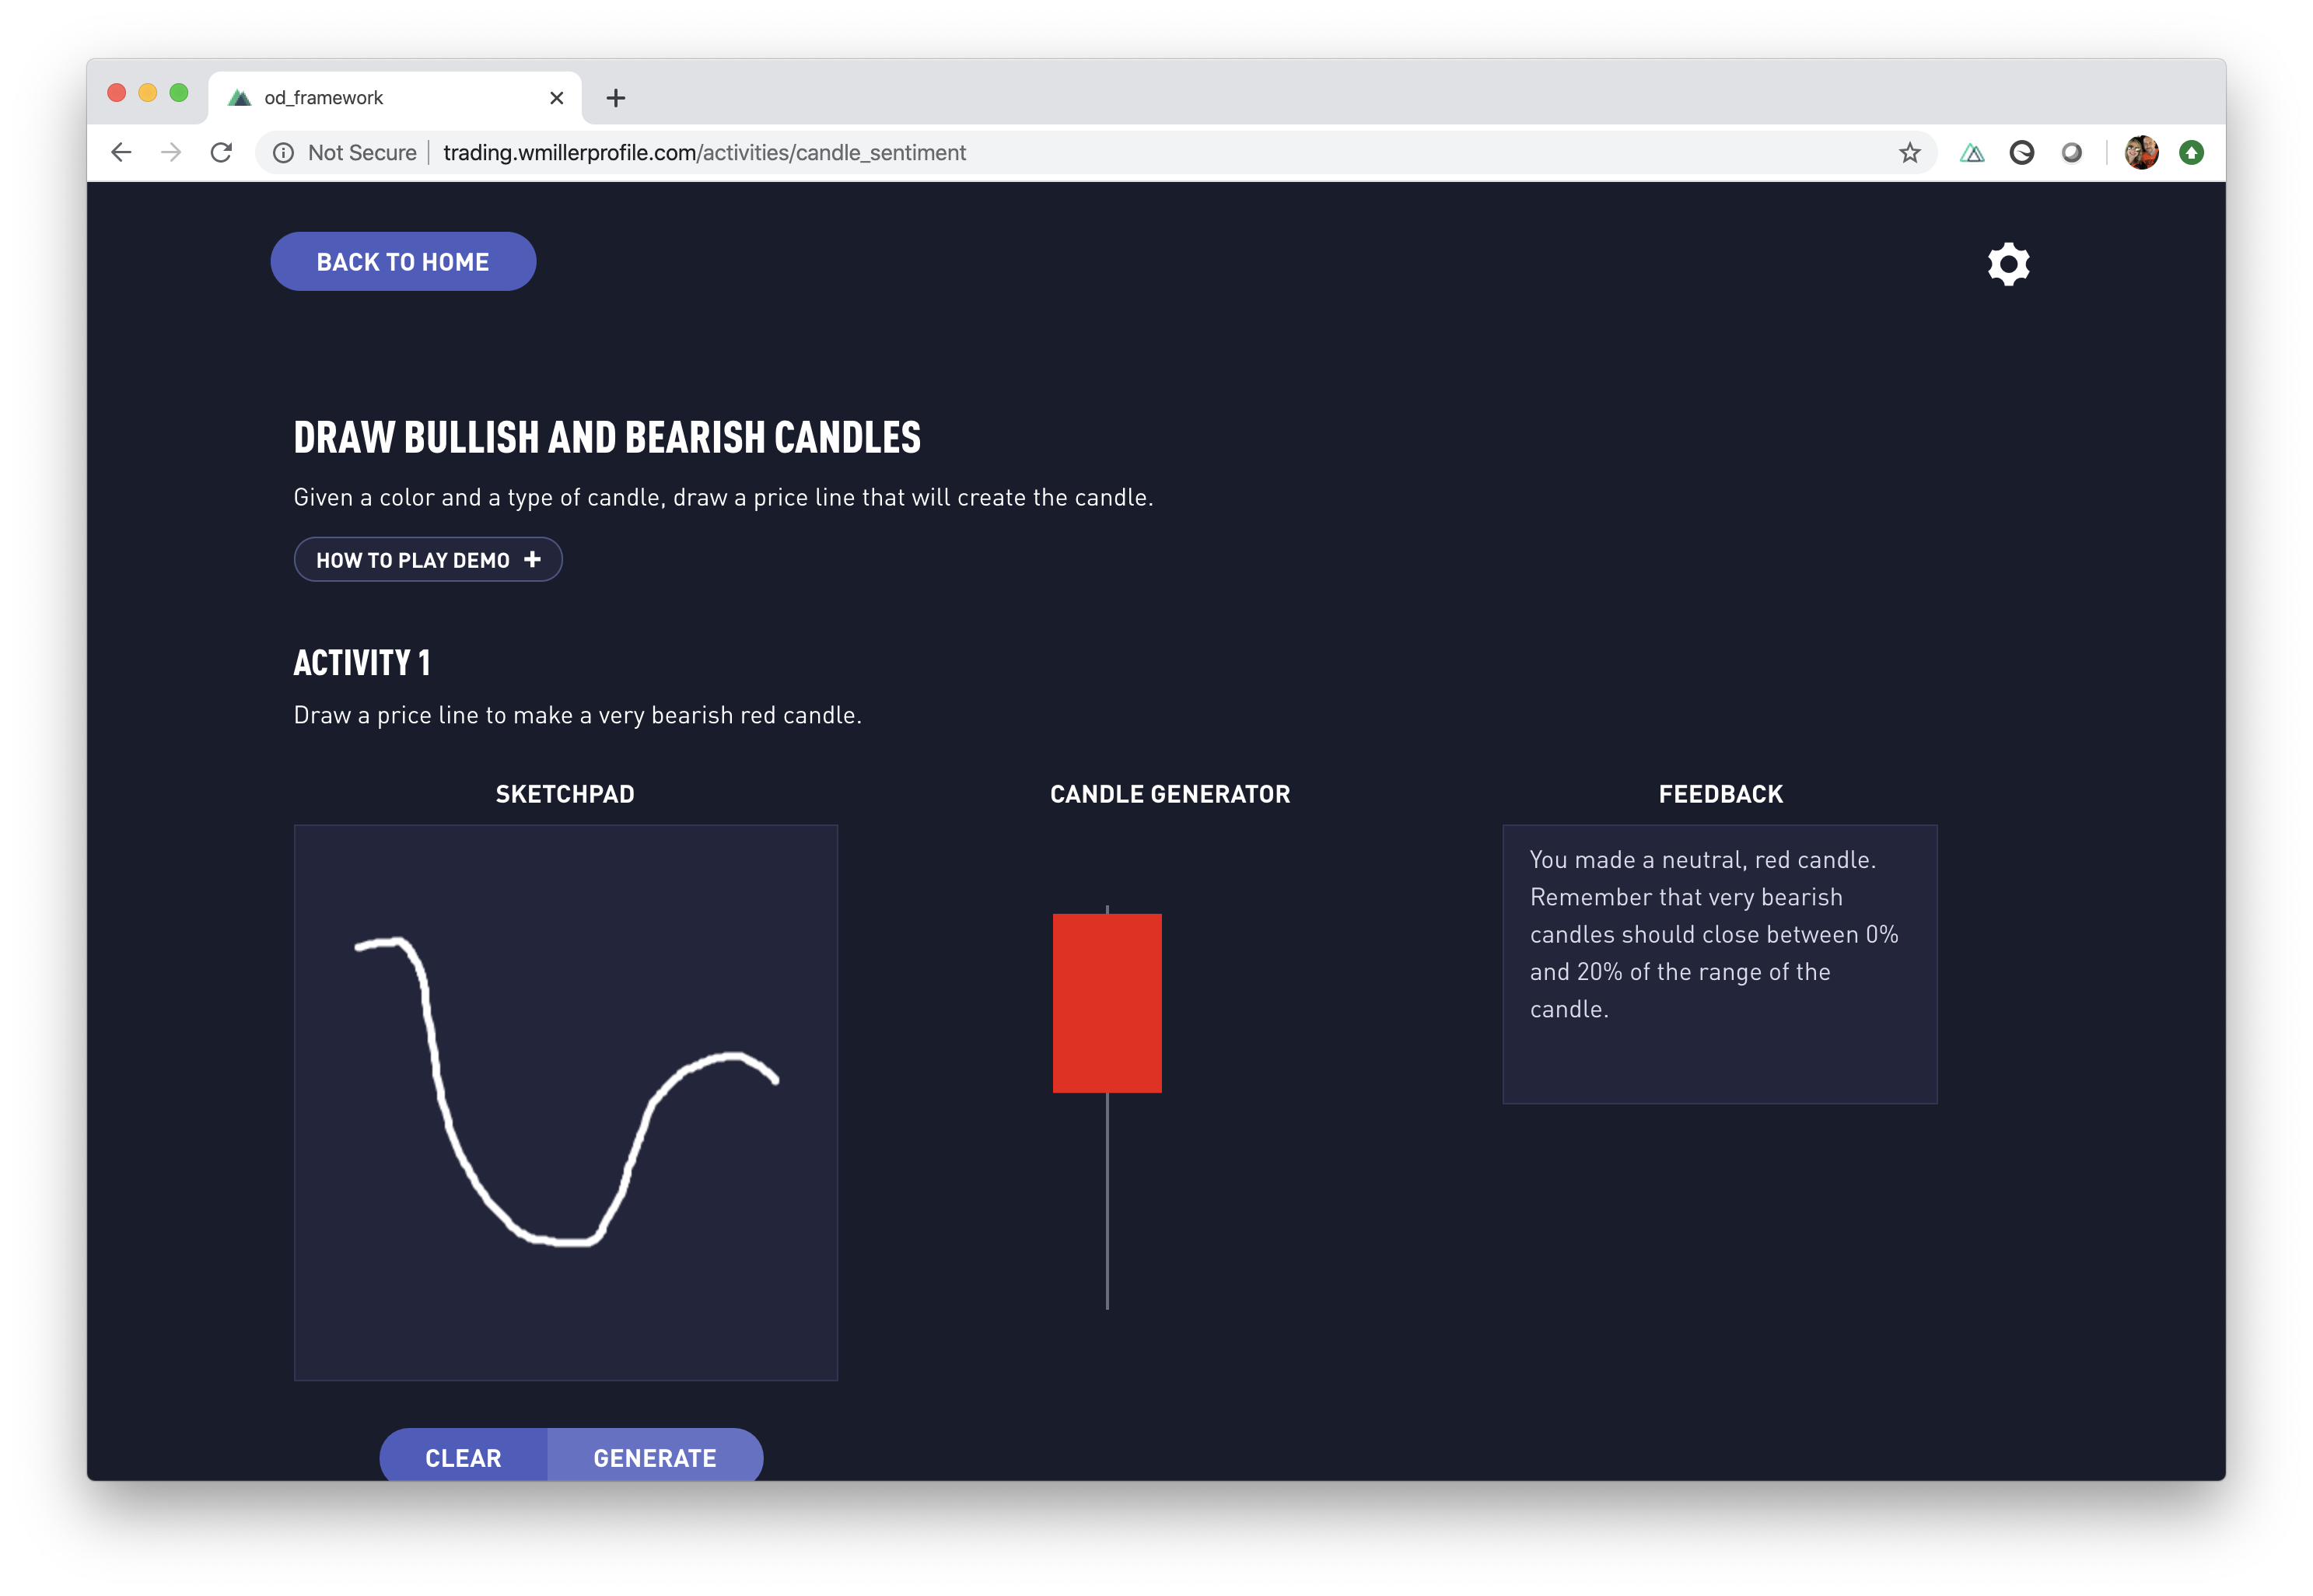
Candle Sentiment
Given a color and a type of candle, draw a price line that will create the candle.

Candle Sequence
In this activity, use the controls to create the following sequence of candles that match the description.

Order States
In this series of activities, explore the relationship between order states and price.

Three Vantage Points on Buying and Selling
Control the animation in this activity and look at how traders, institutions, and you might consider when to buy and sell.
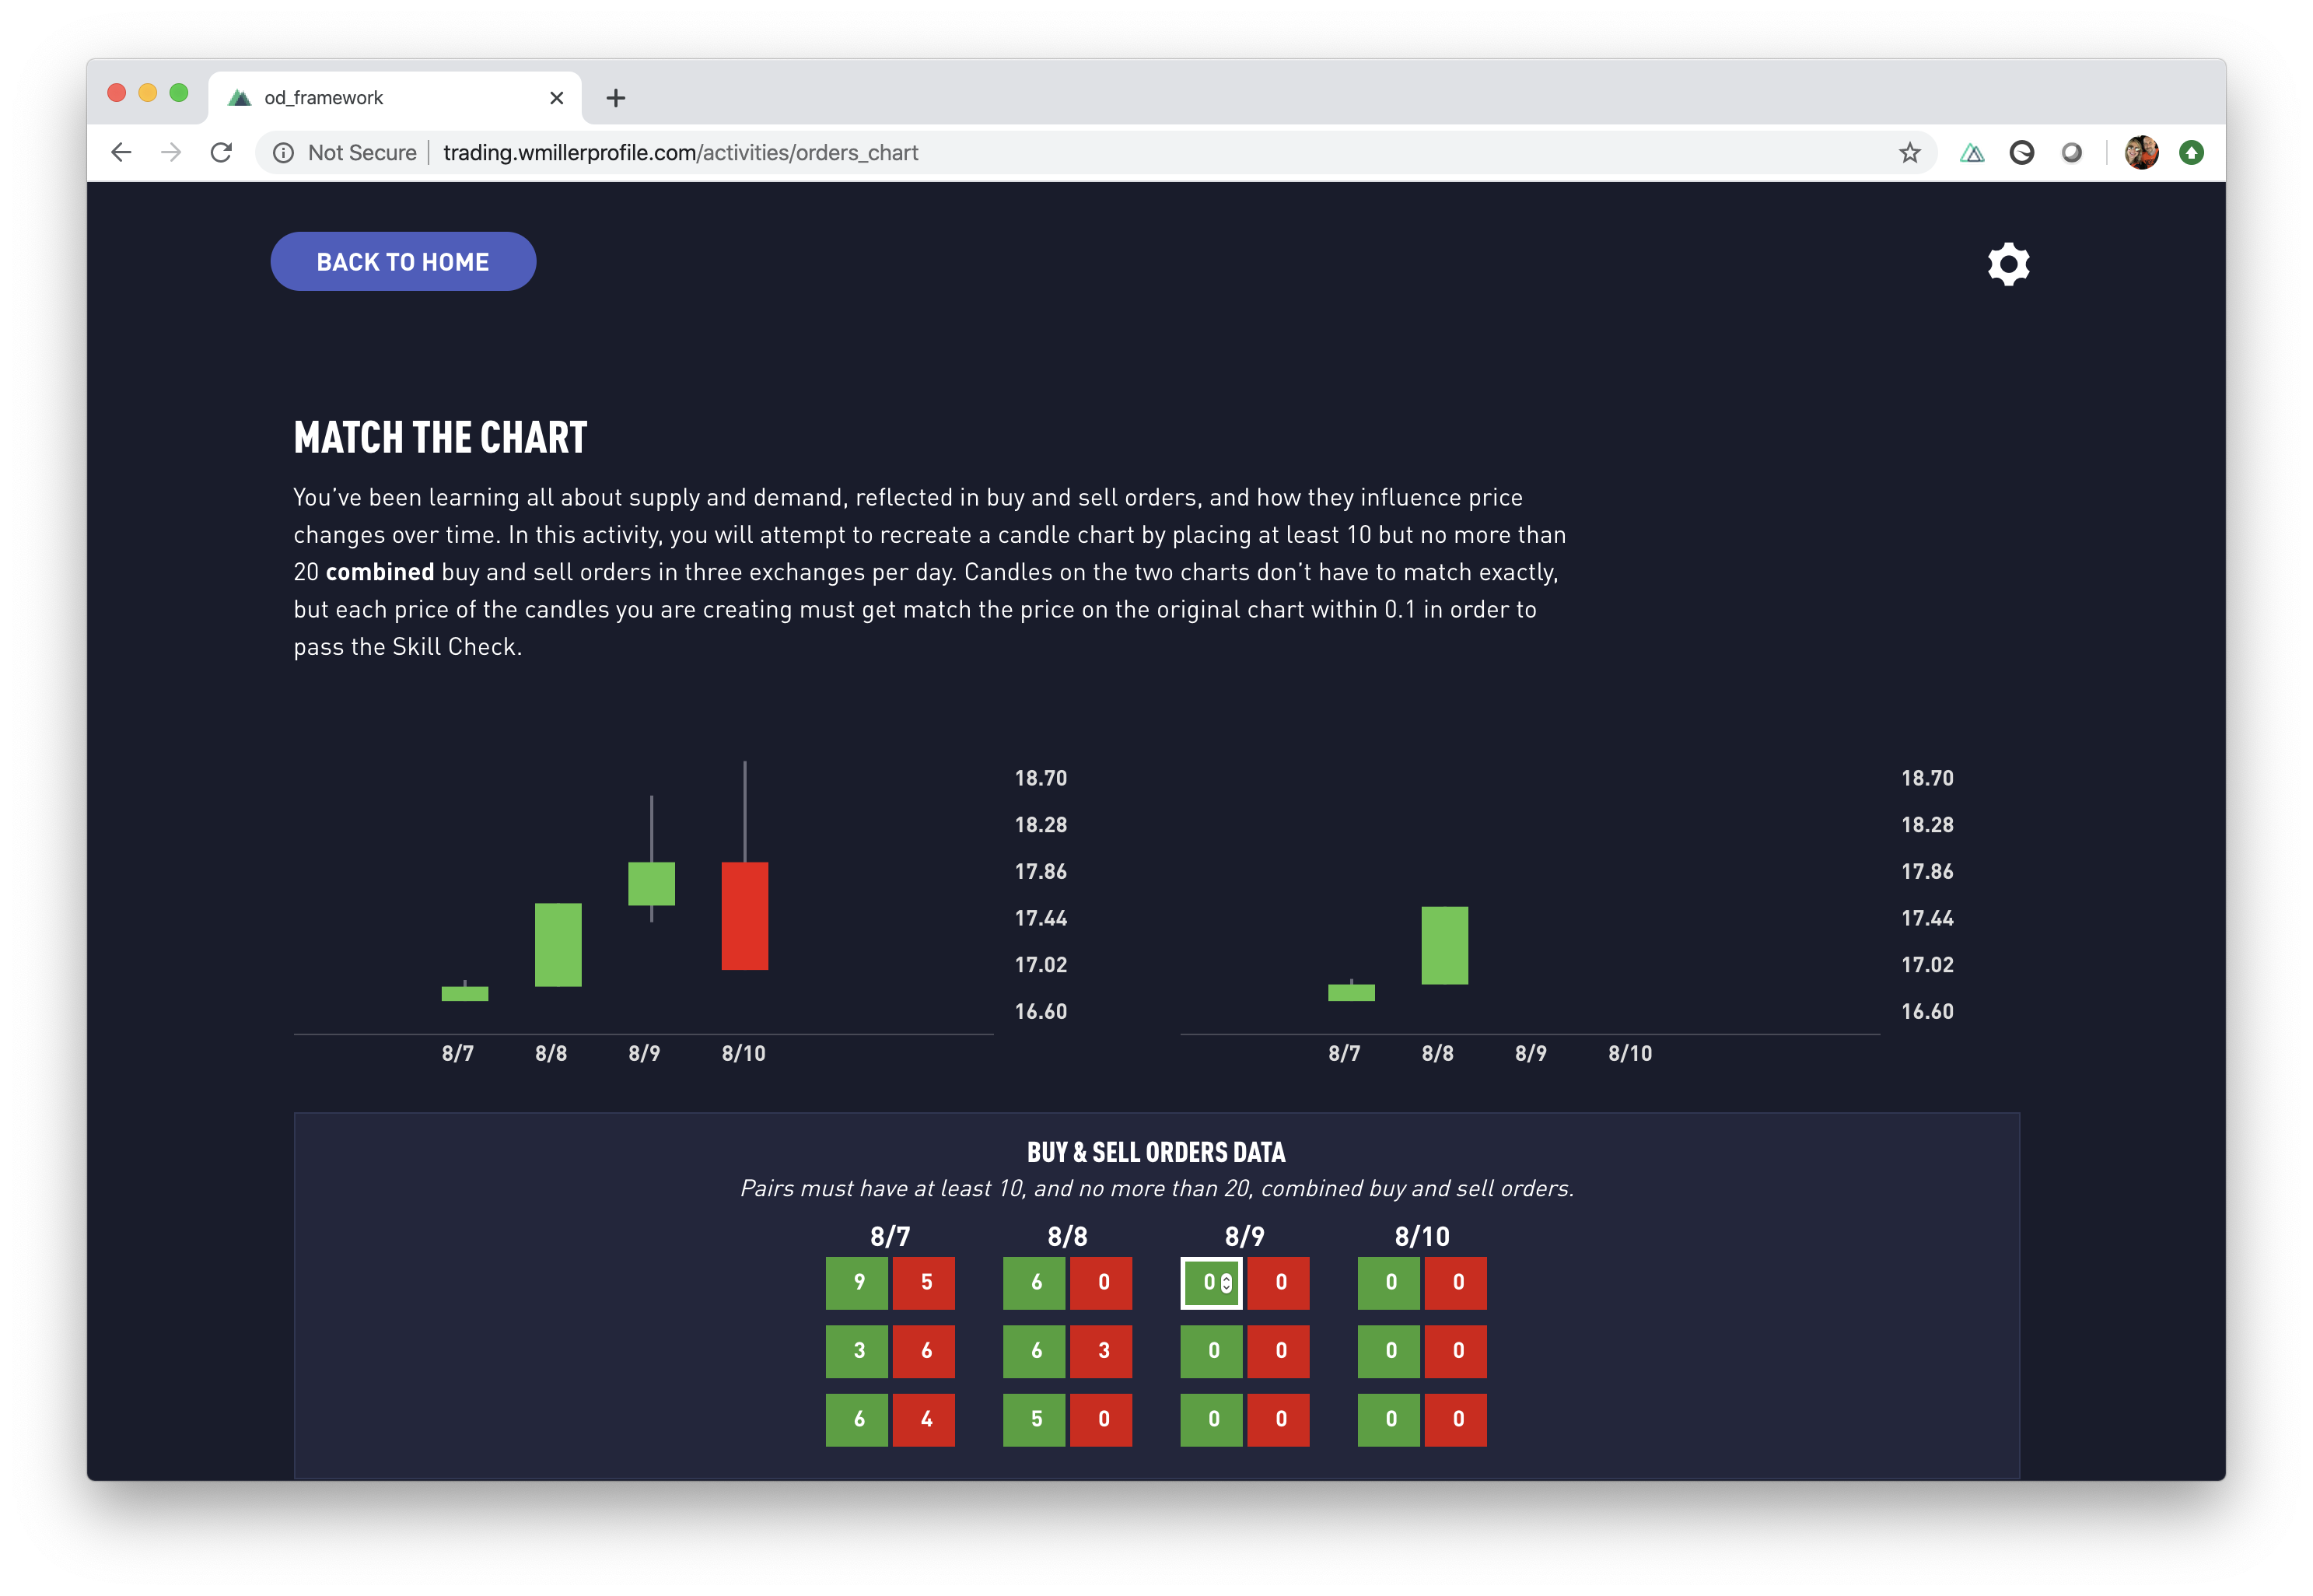
Reverse Engineering a Chart with Orders
Recreate a candle chart by placing at least 10 but no more than 20 combined buy and sell orders in three exchanges per day.

Candle Formations
Sort candles to match formation types, highlight formation types in context, and create supply and demand zones in candle charts.

Reward and Risk
Better understand the importance of reward-to-risk ratios by viewing scenarios, calculating, and creating them.

Making a Trade
Set your stop, entry, and target prices and see how your trade turns out.

Selling Short
In this short tutorial, learn how you can make money trading when prices are falling.
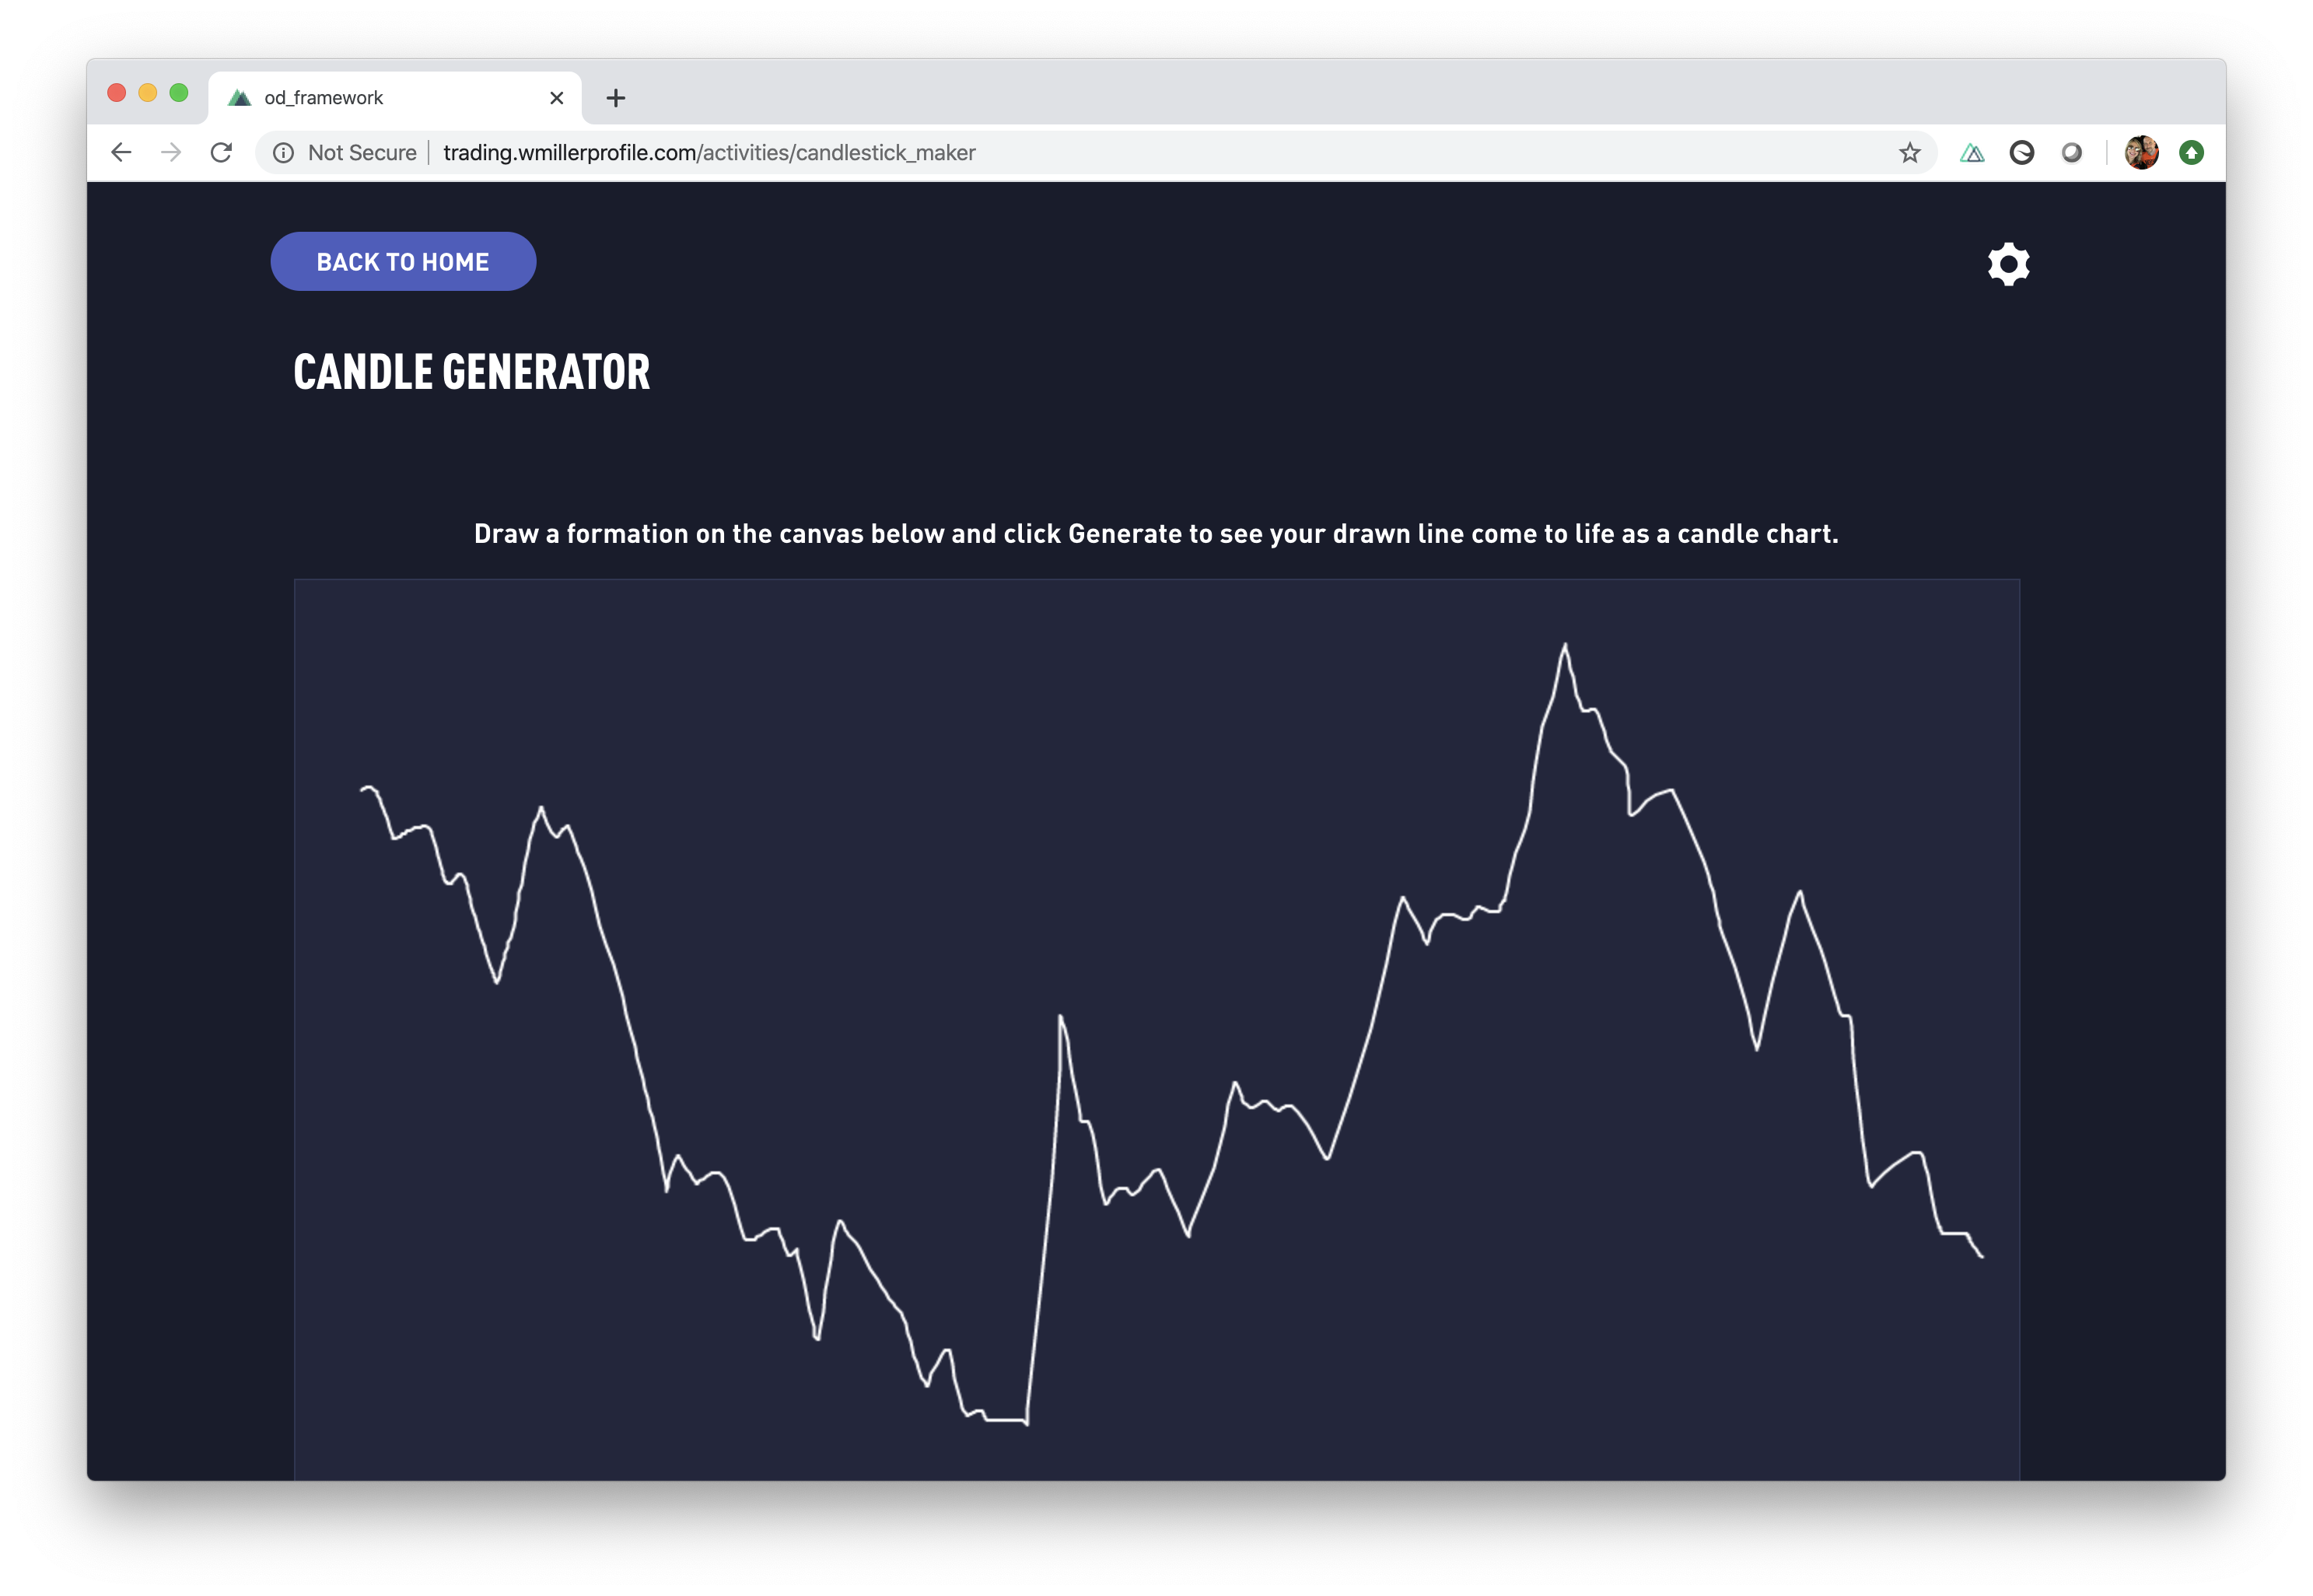
Candle Data Generator
Create candle data by drawing a priceline on a canvas.